Core Web Vitals: A Field Guide to Making Pages Feel Fast
Three metrics that measure what users actually experience, and how to move each one.

6 min read

Three metrics that measure what users actually experience, and how to move each one.
For years, web performance was measured with numbers that felt scientific and correlated poorly with whether a page felt fast. Total page weight, request count, the moment the load event fired — all measurable, none of them describing the actual experience of waiting.
Core Web Vitals replaced that with three metrics tied to things a person notices: how long until the main content appears, how quickly the page responds when you interact, and whether things move around under your finger.
They are also a ranking signal for search, which is why they get attention. But the reason to care is simpler — they measure the difference between a page that feels fast and one that does not.
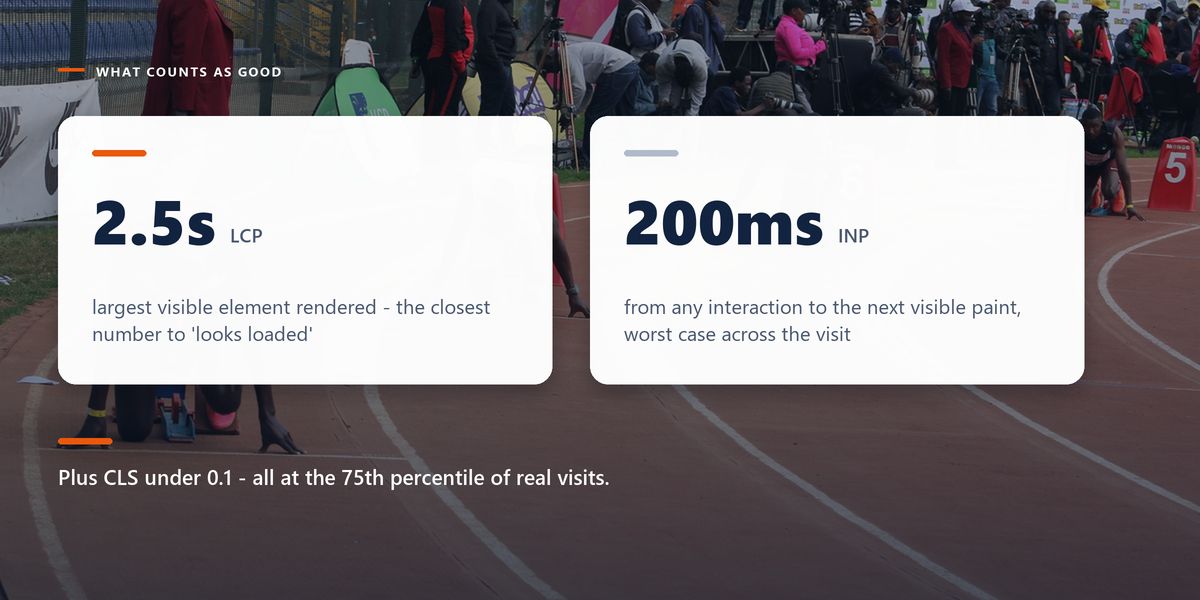
Largest Contentful Paint records when the largest visible element in the viewport finishes rendering — usually a hero image, a heading, or a block of text. It is the closest single number to when does this page look loaded.

A good LCP is 2.5 seconds or less. The causes of a bad one are almost always in this order, and it is worth checking them in this order too.
Nothing can render before the HTML arrives. If time to first byte is already 1.5 seconds, no amount of image optimisation will save you. Caching, a CDN, and moving pages to a more static rendering strategy address this directly.
Stylesheets and synchronous scripts in the head must be downloaded and processed before anything paints. Inline the critical styles, defer everything non-essential, and be suspicious of every third-party tag in the head.
The single most common cause. A 2 MB photograph displayed at 800 pixels wide is downloading roughly ten times the data it needs. Serve modern formats, size images for their display size, and preload the one that will be the LCP element.
By default many browsers hide text while a custom font downloads. That invisible text can be the LCP element, and it does not count as painted until it appears. Using font-display: swap shows fallback text immediately and swaps when the font arrives.
Interaction to Next Paint measures the delay between a user interacting — a tap, a click, a keypress — and the screen visibly updating. It looks at all interactions across the visit and reports a representative worst case, which makes it considerably harder to game than the metric it replaced.
A good INP is 200 milliseconds or less. Almost everything that makes it bad comes down to one cause: JavaScript occupying the main thread when the user does something.
The fastest INP win in most applications is showing a visual response immediately and doing the work after. Toggle the button state, then filter the list. Users interpret responsiveness from the first pixel change, not from when the operation completes.
Cumulative Layout Shift measures how much visible content jumps around during the life of the page. It is the metric behind the universal experience of reaching for a link and having an advert push it out from under your finger.
A good CLS is 0.1 or less, and unlike the other two, it is usually straightforward to fix because the causes are few and mechanical.
| Cause | What happens | Fix |
|---|---|---|
| Images without dimensions | content reflows when the image loads | set width and height, or an aspect ratio |
| Ads and embeds | injected content pushes the page down | reserve the space before it loads |
| Late-loading fonts | text reflows when metrics change | match fallback metrics, use size-adjust |
| Banners inserted at the top | everything below jumps | reserve space or overlay instead |
| Content added above the fold | the reading position moves | insert below, or only after interaction |
This trips up more teams than any technical detail. A lab test runs a page once, on a simulated device and connection, in a controlled environment. It is excellent for diagnosis — it will tell you exactly which resource is blocking rendering.
Field data comes from real visits on real devices. It is what determines whether you pass, and it accounts for the older phone on a weak mobile connection that your test on a desktop with fibre never represented.
The practical consequence: use lab tools to find and fix problems, and field data to decide whether the fix mattered. A perfect lab score with poor field data means your test conditions are not your audience.
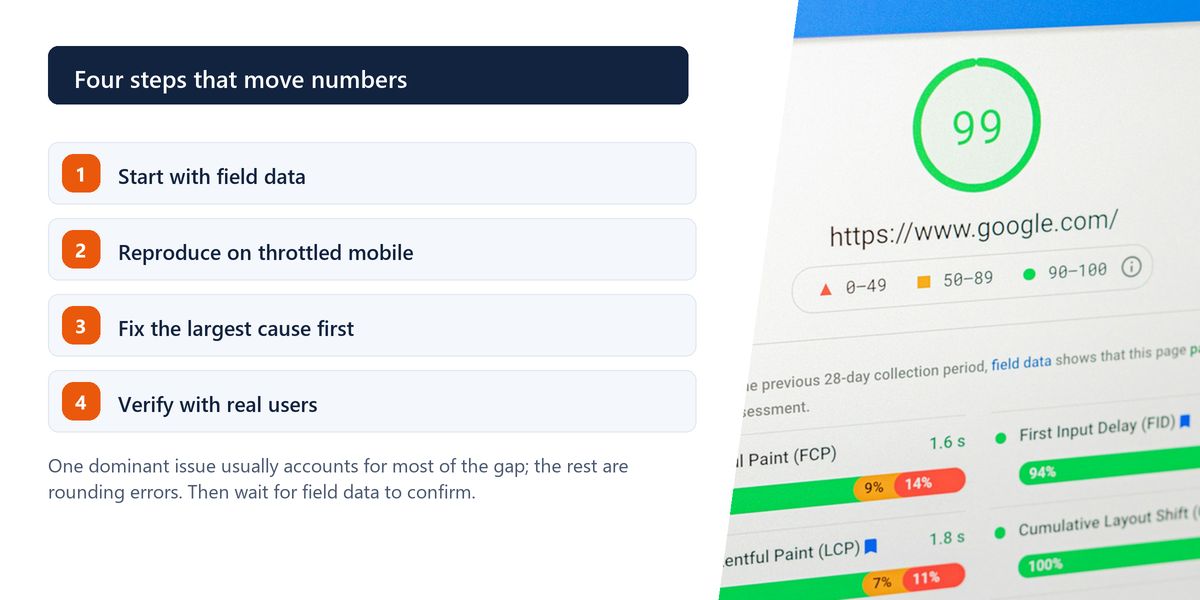
A publisher spent three weeks improving their lab performance score from 61 to 94. Images were compressed, scripts deferred, CSS trimmed. Everyone was pleased.
Field data barely moved. The tests had been run on a fast desktop connection, where their real bottleneck was invisible: a personalisation script that fetched user segments before rendering the article body, adding 1.8 seconds on mobile networks.
Deferring that script until after first paint improved real-user LCP by more than everything else combined. The lab score went up by two points, which is a decent illustration of what lab scores are and are not for.
Third-party scripts are the most common cause of a page that is fast in development and slow in production. They are added by people outside the engineering team, they change without notice, and each one runs on the same main thread as your application. Audit them regularly, and load everything non-essential after first paint.
Optimise for the person on a three-year-old phone on a busy network. If the page is fast for them, it is fast for everyone.
— The only benchmark that matters
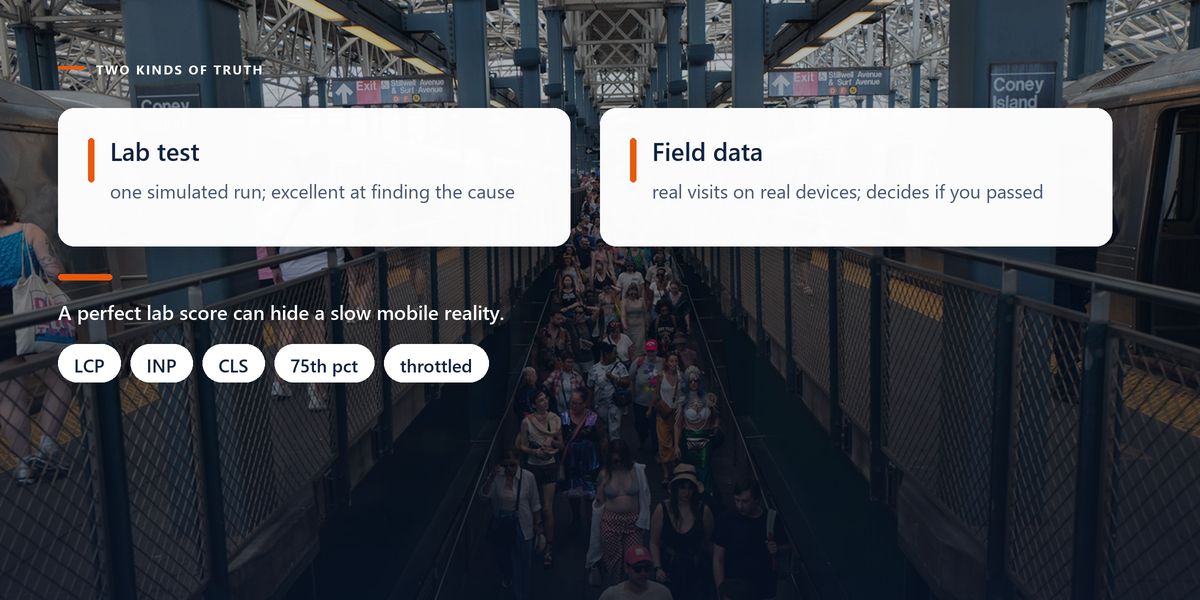
LCP measures when the main content appears, INP how quickly the page responds, and CLS how much it moves. Fix server response before assets, break up long JavaScript tasks, reserve space for anything that loads late, and always confirm improvements with real-user data rather than a lab score.
Core Web Vitals are useful because they are boring in the right way: they measure waiting, unresponsiveness and things moving unexpectedly, which are exactly the three ways a website annoys people.
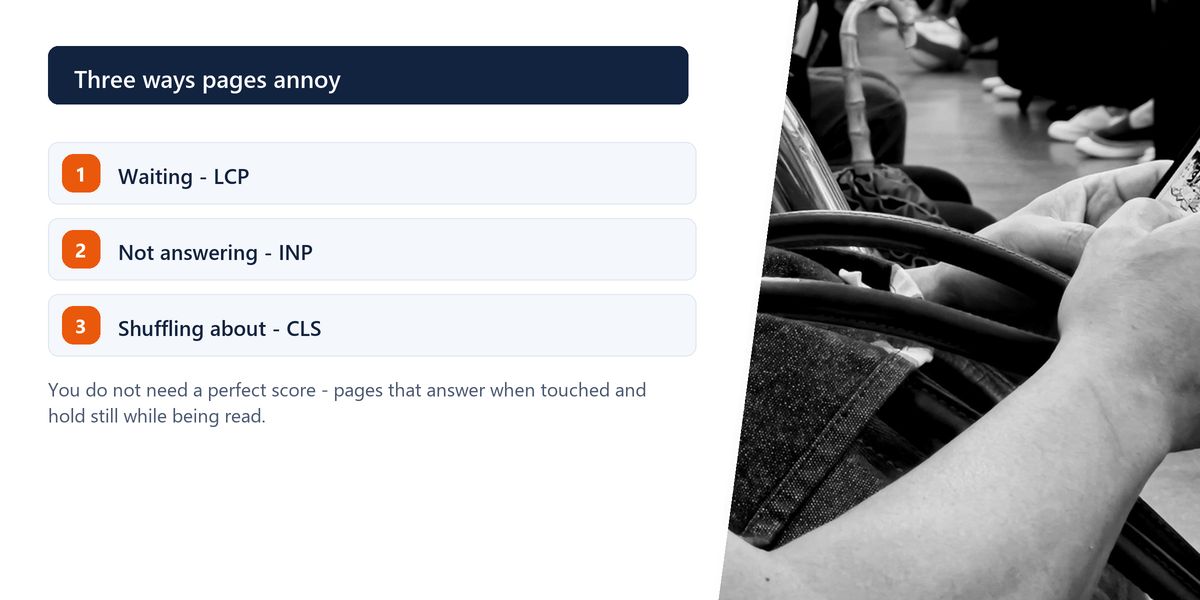
You do not need a perfect score. You need pages that respond when someone touches them and do not shuffle around while they read. Everything else is detail.
Tap a star to share what you thought.
No ratings yet
Three metrics measuring real user experience: Largest Contentful Paint for loading, Interaction to Next Paint for responsiveness, and Cumulative Layout Shift for visual stability. They are assessed at the 75th percentile of real visits.
2.5 seconds or less at the 75th percentile. Between 2.5 and 4 seconds needs improvement, and above 4 seconds is poor. Server response time and the hero image are the two most common causes of a bad result.
Interaction to Next Paint became the responsiveness metric in 2024. Unlike First Input Delay, which only measured the delay before processing the first interaction, INP considers all interactions and includes the time until the screen actually updates.
Sign in to join the conversation.
Loading responses…
Have a story, idea, or something valuable to share? Join The Blog Story for free, publish your content, reach more readers, and earn a share of advertising revenue from eligible content.
Create quality content. Grow your audience. Grow your earning potential.
Set explicit width and height or an aspect ratio on images and video, reserve space for ads and embeds before they load, avoid inserting banners above existing content, and make fallback font metrics close to the web font's.
Because your test conditions do not match your audience. Lab tests typically run on fast connections and capable hardware, while real visitors are often on mid-range phones and variable mobile networks. Always confirm with field data.
They are part of Google's page experience signals, so they contribute to ranking, though relevance and content quality matter far more. The stronger argument is behavioural: slow, unstable pages lose users regardless of where they rank.
JavaScript occupying the main thread when the user interacts — long tasks, heavy event handlers, expensive re-renders and third-party scripts. Breaking work into smaller chunks and responding visually before doing the work are the most effective fixes.
No. Chasing the last few points usually costs more than it returns. Aim to be comfortably inside the good thresholds for real users on mid-range devices, then spend your remaining effort elsewhere.