How to Think About Risk and Probability in Everyday Life
Human intuition about chance is reliably wrong in specific, predictable ways.

6 min read

—Not yet rated
Human intuition about chance is reliably wrong in specific, predictable ways.
Humans are excellent at many things and consistently poor at estimating probability. This is not a matter of education — the same errors appear in people who work with numbers professionally, once the question is framed the right way.
The errors are specific and repeatable, which makes them learnable. A handful of concepts covers most of what goes wrong in reading news, health advice and everyday decisions.
None of this requires mathematics beyond arithmetic. It requires knowing which questions to ask.
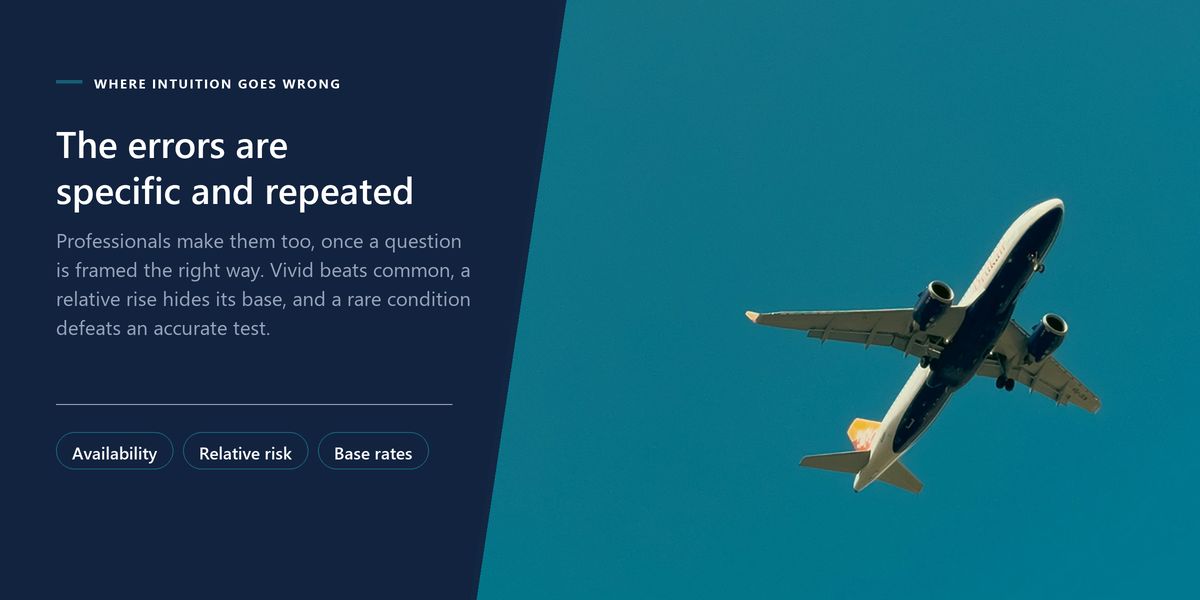
People estimate how likely something is by how readily they can recall an instance. Since memorable, dramatic and heavily reported events come to mind easily, they feel far more probable than they are.
This is why plane crashes feel more dangerous than car journeys despite the statistics, and why shark attacks occupy more mental space than the vastly more common hazards of falls and household accidents. Rare and vivid beats common and mundane, every time.
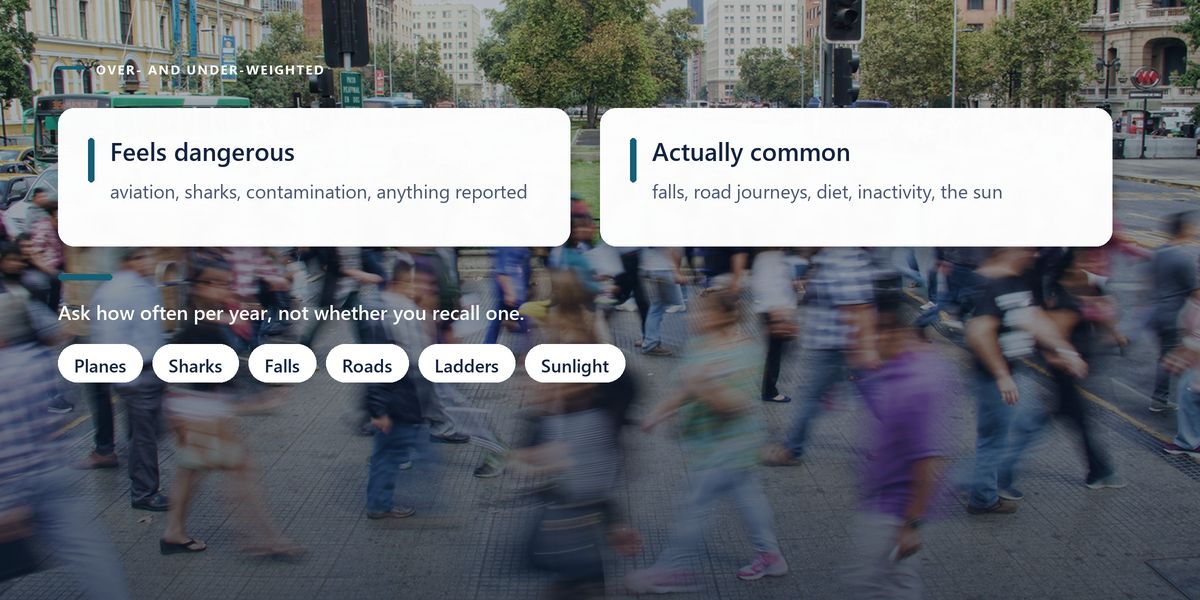
The correction is to ask about frequency rather than about examples. Not can I think of a case, but how often does this happen per year, per person. Those questions frequently produce very different answers.
This is the single most useful thing to learn for reading health news, and it is the source of a large share of misleading headlines.
A headline saying something doubles your risk is uninterpretable on its own. Doubling a risk from one in a million to two in a million is negligible. Doubling from one in ten to two in ten is enormous. The relative change is identical; the meaning is entirely different.
So whenever you see a percentage increase, ask what the underlying rate was. If the article does not say, that omission is usually deliberate, because the absolute numbers are less dramatic.
This is the most counter-intuitive item on the list, and it matters enormously for medical testing.
Imagine a condition affecting one person in a thousand, and a test that is 99% accurate in both directions. You test positive. What is the chance you have the condition?
Most people, including many clinicians in studies, answer around 99%. The actual answer is roughly 9%.
The reason becomes obvious with whole numbers. Test 10,000 people. About 10 have the condition, and the test correctly identifies around 10 of them. Of the 9,990 who do not, 1% get a false positive — that is about 100 people. So roughly 110 people test positive and only 10 actually have it.
This is not a criticism of testing, which remains extremely useful. It is why a positive result on a screening test for a rare condition is normally followed by a second, different test rather than treated as a conclusion.
| Of 10,000 people tested | Have the condition | Do not have it |
|---|---|---|
| Actual numbers | 10 | 9,990 |
| Test positive | about 10 | about 100 (false positives) |
| Test negative | about 0 | about 9,890 |
| So a positive result | is right about 9% of the time | with this rarity and accuracy |
Convert probabilities into natural frequencies — 'about 3 people in 100' rather than '3%' or 'a 0.03 probability'. Research consistently finds that people, including professionals, reason far more accurately with whole numbers out of a fixed group than with percentages or decimals.
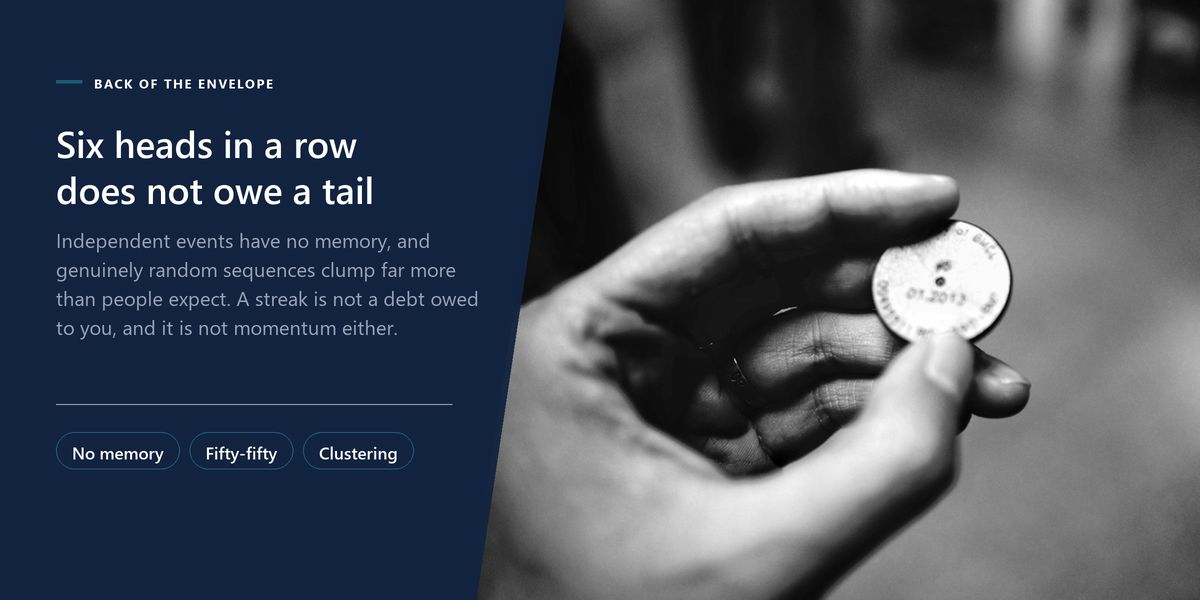
A coin has landed heads six times. People overwhelmingly feel tails is now more likely. It is not — the coin has no memory, and the next flip remains fifty-fifty.
This intuition is strong and it drives real behaviour: lottery numbers chosen because they are 'due', roulette systems, and the belief that a run of bad luck must end. It also appears in more respectable settings, such as expecting a sequence of poor results to correct itself for statistical reasons rather than causal ones.
The related error runs the opposite way — assuming a streak will continue because someone is 'hot'. Both mistake randomness for a process with momentum, and genuinely random sequences contain far more clustering than people expect.
Extremes are more likely in small samples, purely as a matter of arithmetic. A survey of twenty people can easily produce a dramatic percentage that means nothing, and the smallest towns appear at both the top and the bottom of most health and crime rankings for exactly this reason.
Whenever you see a surprising statistic, ask how many people or events it is based on. Journalists frequently do not report it, and it is often the entire explanation for the surprise.
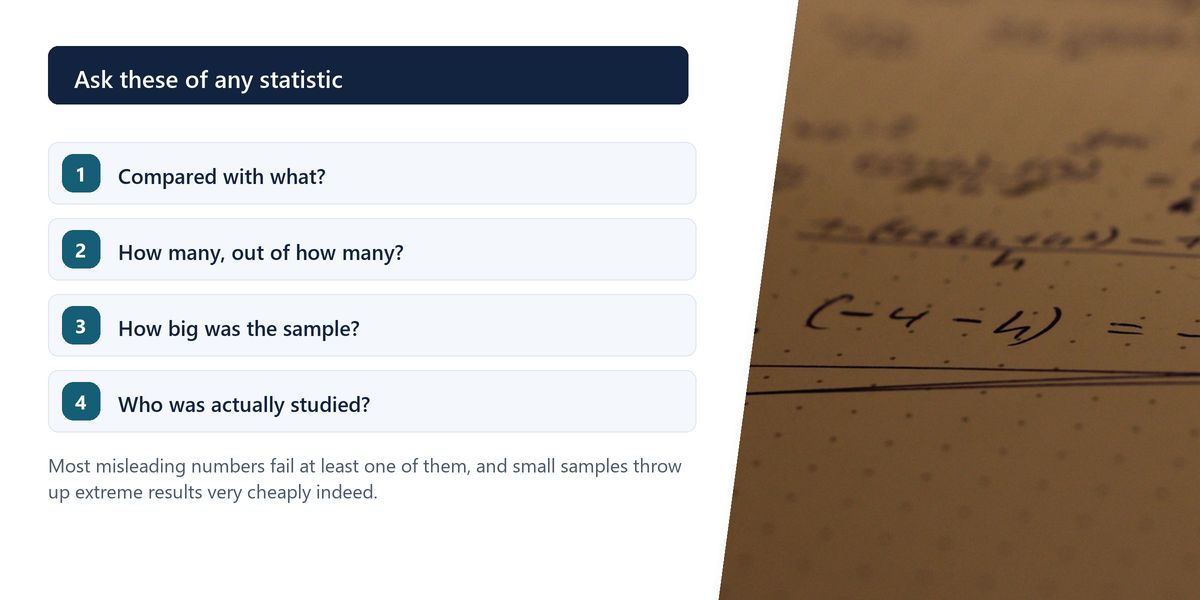
The practical payoff is not becoming a statistician. It is asking four questions when a number is presented.
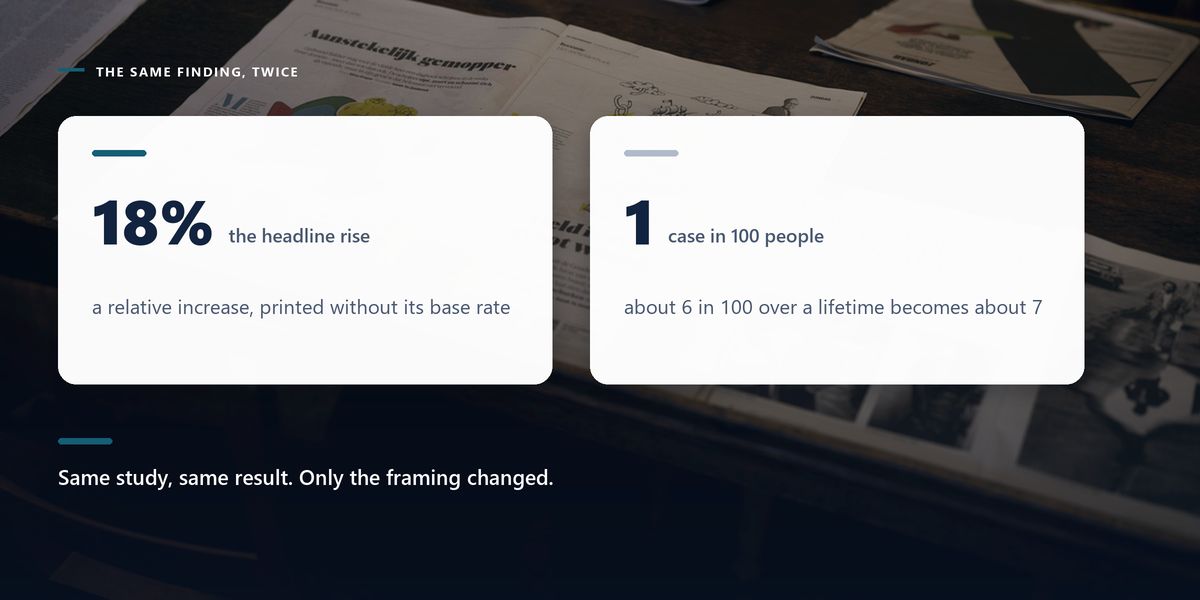
A widely shared headline reported that a common dietary habit raised the risk of a particular cancer by 18%. It was covered across several outlets and prompted a good deal of concern.
The underlying study reported an absolute change from roughly 6 cases per 100 people over a lifetime to about 7. The 18% was a relative increase on a modest base.
That is a genuine finding and worth knowing, and it is a materially different thing from what most readers took away. The number was not wrong; the framing simply omitted the only piece of context that made it interpretable.
Understanding these ideas is not a substitute for expertise or for medical advice. Statistical literacy helps you interpret what you are told and ask better questions; it does not qualify anyone to overrule a doctor, and 'doing your own research' on probability grounds has caused real harm. Use it to understand, not to dismiss.
Because of these biases, certain risks are consistently over-weighted and others under-weighted.
Over-weighted: rare violent events, aviation, unfamiliar technologies, anything involving contamination or dread, and anything heavily covered in news. Under-weighted: falls, road travel by car, poor diet and inactivity, sun exposure, and everyday domestic hazards. The pattern is consistent — the familiar and the gradual feel safer than they are.
Vividness distorts frequency estimates. Relative risk needs an absolute base rate to mean anything. Base rates dominate test results for rare conditions. Independent events have no memory, and small samples produce extreme values. Ask what the comparison is, how many out of how many, how large the sample was, and who was included.
None of this makes anyone immune to the errors, including people who study them. What it does is make the errors recognisable when a number arrives with a headline attached.
That single habit — asking what the absolute numbers are — will improve how you read health, crime and financial news more than anything else on this page.
Tap a star to share what you thought.
No ratings yet
Relative risk describes the change as a proportion of the original — 'doubles your risk'. Absolute risk gives the actual rate, such as 2 in 1,000 rather than 1 in 1,000. A relative figure without the absolute base rate is essentially uninterpretable.
Because of base rates. If a condition affects 1 in 1,000 people, testing 10,000 produces about 10 true positives and about 100 false positives, so a positive result is correct only around 9% of the time. This is why screening positives are usually confirmed with a second test.
The belief that independent random events are influenced by past results — that a coin showing six heads is now 'due' a tail. Each flip remains independent, and genuinely random sequences contain far more clustering than people intuitively expect.
Because we estimate probability by how easily examples come to mind, and dramatic, heavily reported events are memorable. That makes plane crashes feel riskier than car journeys, despite the statistics pointing firmly the other way.
As natural frequencies — 'about 3 people in 100' rather than percentages or decimal probabilities. Research consistently shows that people, including trained professionals, reason more accurately with whole numbers out of a fixed group.
Because small samples produce extreme values more readily. With few people or events, a couple of cases move the rate dramatically. Always ask how many observations a surprising statistic is based on.
Sign in to join the conversation.
Loading responses…
Have a story, idea, or something valuable to share? Join The Blog Story for free, publish your content, reach more readers, and earn a share of advertising revenue from eligible content.
Create quality content. Grow your audience. Grow your earning potential.