Cleaning Messy Data: The Unglamorous Work That Decides Every Analysis
Most analytical mistakes are made long before anyone runs a model.

6 min read

Most analytical mistakes are made long before anyone runs a model.
Every data course starts with a clean dataset. Every real project starts with a spreadsheet where someone has typed the date four different ways, three rows are duplicated, and a column called status contains the values active, Active, ACTIVE and, memorably, actve.
This is not an edge case. It is the job. The modelling is the part that gets discussed; the cleaning is the part that determines whether the result means anything.
What follows is a repeatable method, in the order that actually works. Doing these steps out of sequence is how people spend an afternoon fixing outliers in a column they later discover was duplicated.
Resist the urge to start fixing. Spend the first twenty minutes describing what you have: row count, column types, missing-value counts per column, unique-value counts, and the minimum and maximum of every numeric field.

That last one catches an astonishing number of problems. Ages of 999. Prices of zero. A date range that starts in 1900 because someone used a null-date placeholder. You will find things here that no amount of later modelling would have revealed.
Write your profiling as a script, not a session of interactive poking. When the data refreshes next month you will want to run exactly the same checks — and you will want to know which of them started failing.
Structural problems make every subsequent check unreliable, so they come first. Look for merged header rows, columns holding two facts at once, a single column that is sometimes a name and sometimes a code, and the classic spreadsheet crime of a total row sitting at the bottom of the data.
The goal is tidy data: one row per observation, one column per variable, one value per cell. Almost every downstream tool assumes this, and almost every messy dataset violates it somewhere.
Exact duplicate rows are easy. The interesting ones are near-duplicates: the same customer entered twice with a trailing space, a different capitalisation, or a slightly different spelling of the same street.
Before removing anything, ask what a duplicate means here. Two identical transaction rows might be a data error, or might be a customer genuinely buying the same coffee twice. Only domain knowledge answers that, and getting it wrong silently deletes real events.
The first question is never how do I fill this. It is why is it missing, because the answer changes what you are allowed to do.
| Why it is missing | What it looks like | Reasonable approach |
|---|---|---|
| Not applicable | spouse name for single people | keep as a real category, do not fill |
| Not collected yet | recent rows missing a slow field | exclude the incomplete period |
| Random glitch | scattered, no pattern | impute, and flag that you did |
| Systematically absent | high earners skipping income | document it; imputation will bias results |
Filling missing numbers with zero is the most common and most damaging shortcut. Zero is not unknown — it is a specific value that drags every mean, sum and correlation towards it. If you must impute, a median is usually safer, and adding a boolean was_missing column preserves the information you just erased.
This is the tedious, high-value part. Dates are the worst offenders: the string 03/04/2026 is the third of April or the fourth of March depending on where the person typing it lived. If a dataset mixes conventions, some of your dates are simply wrong and nothing about them looks wrong.
Spreadsheet software has a long history of silently reformatting data on import — turning gene names into dates, dropping leading zeros from identifiers, and rounding long numbers. If a dataset has passed through a spreadsheet, verify the identifier columns before trusting anything joined on them.
An outlier is not automatically an error. A single enormous order might be a data-entry mistake, or it might be the wholesale customer who accounts for a third of your revenue. Deleting it because it sits three standard deviations out is not cleaning; it is editing reality to be more convenient.
Investigate first. If a value is impossible — a negative age, a delivery date before the order date — it is an error and you can treat it as one. If it is merely extreme, it usually stays, and you note it.
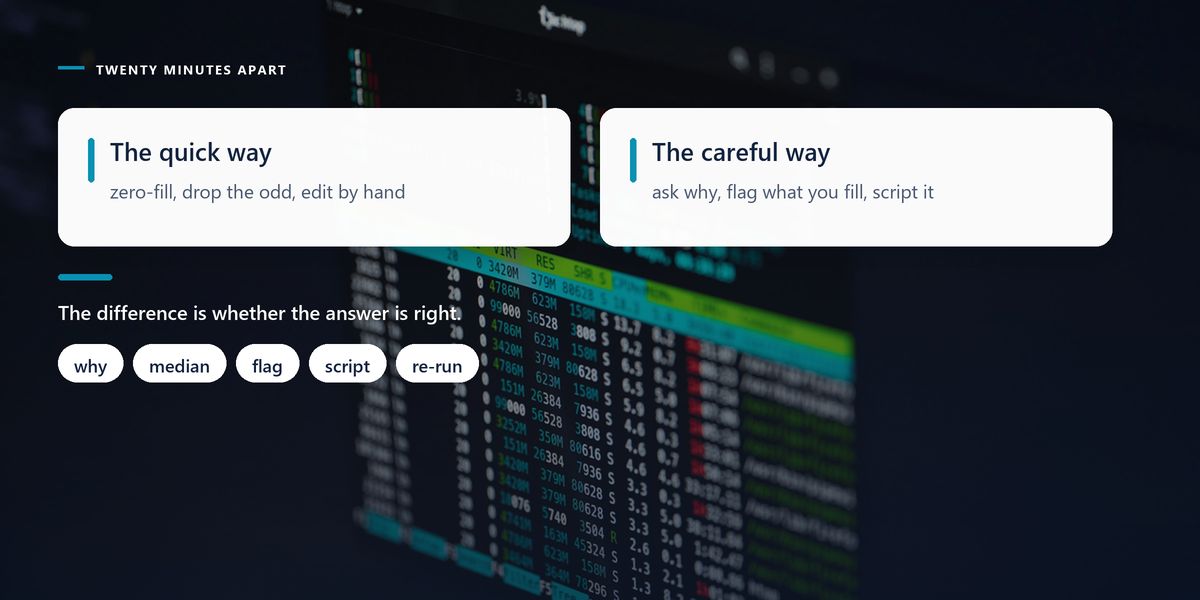
Finish by writing explicit checks that the cleaned data must pass: row counts within an expected range, no nulls in required columns, categorical fields containing only known values, dates inside a plausible window, totals reconciling against a source you trust.
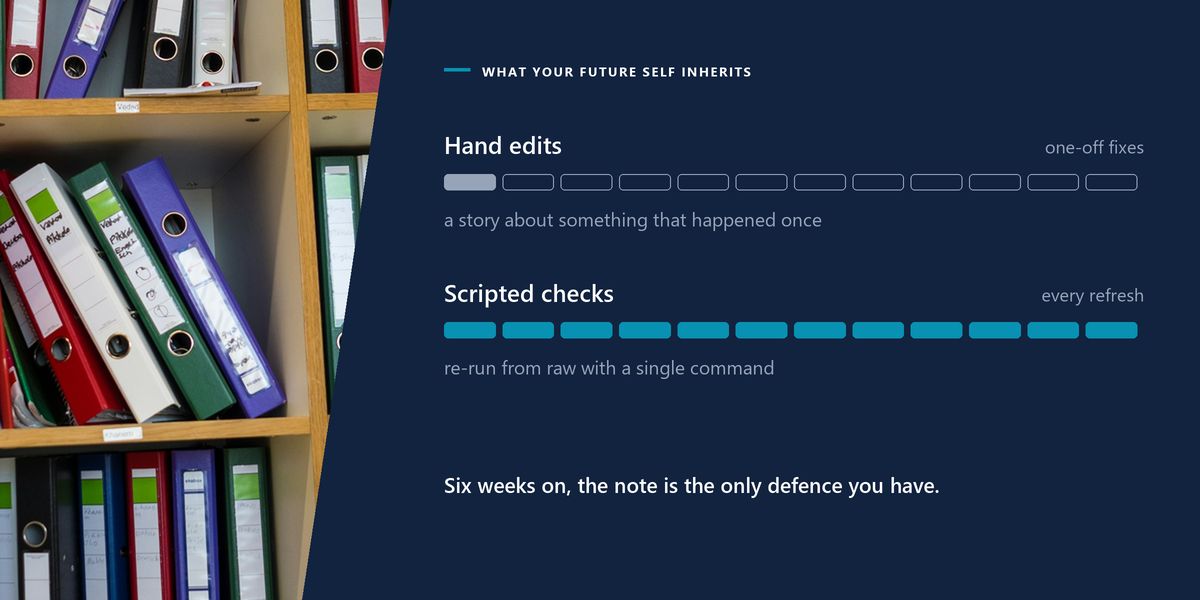
Run those checks every time the data refreshes. They will catch the day an upstream system changes its date format, which it will, without telling anyone.
A retail analyst produced a monthly regional sales report. For half a year, one region looked like it was steadily declining, and a plan was drawn up to intervene.
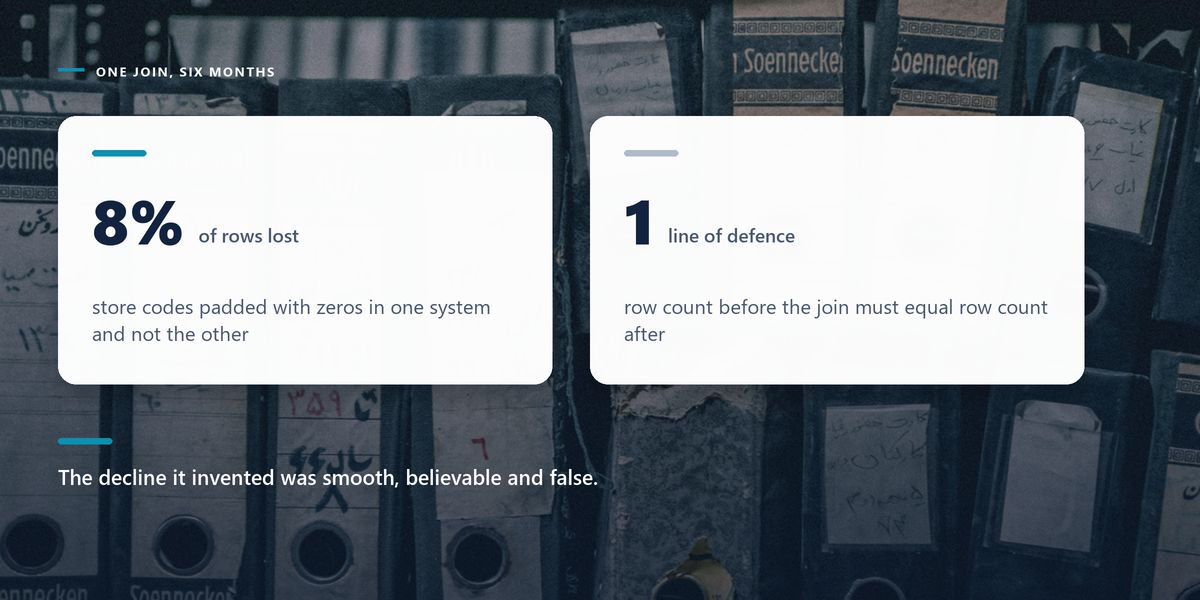
The cause turned out to be a join. Store codes came from two systems: one padded them to five characters with leading zeros, the other did not. Around 8% of transactions failed to match a store and were dropped from the regional totals — always the same stores, so the decline looked smooth and believable.
A single validation rule caught it afterwards: transaction count after the join must equal transaction count before. It had taken six months to notice, and it took one line to prevent forever.
Cleaning is a series of judgement calls, and six weeks later you will not remember why you dropped those 43 rows. Keep the cleaning in version-controlled code rather than manual edits, log how many rows each step removed or changed, and write a short note for every non-obvious decision.
If the cleaning cannot be re-run from the raw file with one command, the analysis is not reproducible — it is a story about something that happened once.
— The reproducibility test
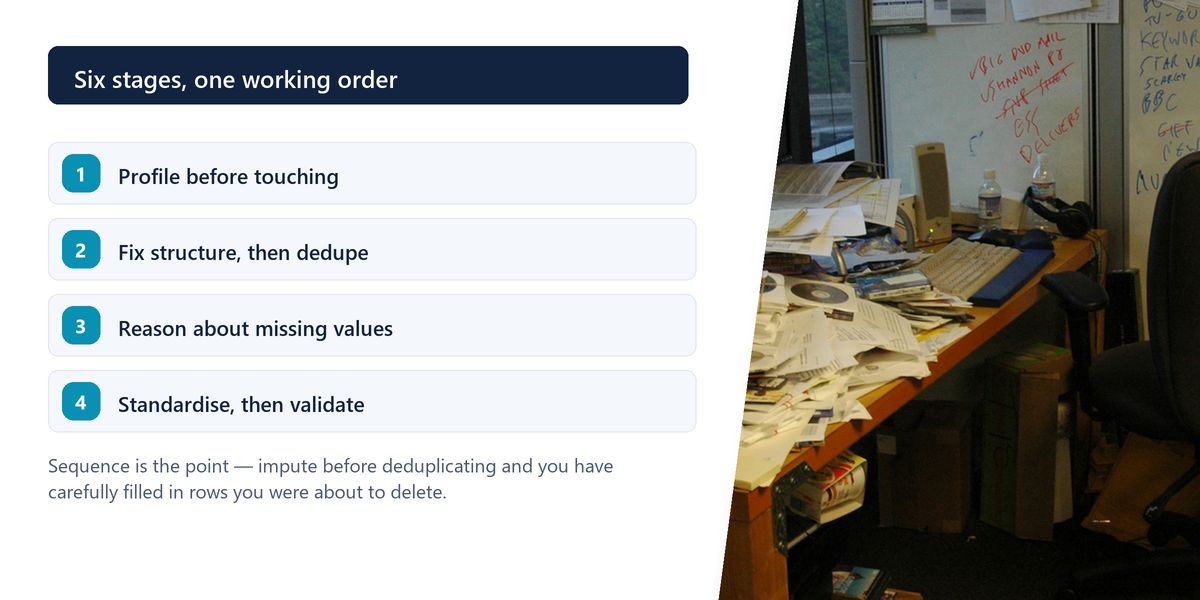
Profile, then fix structure, then deduplicate, then handle missing values with reasoning rather than reflex, standardise types and units, investigate outliers instead of deleting them, and finish with validation rules that run on every refresh.
Nobody puts data cleaning in the highlight reel. It is also the single largest determinant of whether an analysis is true. A modest model on carefully prepared data beats a sophisticated one on a dataset with a broken join, every time.
Do the boring part properly and the interesting part gets much easier — and, more importantly, much more likely to be right.
Tap a star to share what you thought.
No ratings yet
Profiling the dataset, correcting its structure, removing genuine duplicates, deciding how to treat missing values, standardising types and units, investigating outliers, and writing validation rules that run whenever the data refreshes.
Almost never by default. Zero is a real value that pulls means, sums and correlations towards it. Understand why the value is missing first; a median plus a separate 'was missing' flag preserves more information and biases less.
Ask whether the value is impossible or merely unusual. Negative ages and delivery dates before order dates are errors. A very large order is probably a real customer, and removing it because it is inconvenient distorts the analysis.
Sign in to join the conversation.
Loading responses…
Have a story, idea, or something valuable to share? Join The Blog Story for free, publish your content, reach more readers, and earn a share of advertising revenue from eligible content.
Create quality content. Grow your audience. Grow your earning potential.
Because the same string means different days in different conventions, and mixed-format data produces wrong dates that look completely normal. Parse explicitly to one format and sanity-check the resulting range.
Postcodes, phone numbers and account codes often carry leading zeros that vanish the moment a tool treats them as numbers. Once lost, joins fail silently and rows quietly disappear from your results.
A structure where each row is one observation, each column is one variable, and each cell holds a single value. Most analysis tools assume it, and most messy datasets break it in at least one place.
Keep it in version-controlled code that runs from the raw file, log how many rows each step changes, and note the reasoning behind non-obvious decisions. Manual spreadsheet edits cannot be re-run or reviewed.
Row counts within an expected range, no nulls in required fields, categorical columns containing only known values, dates inside a plausible window, and row counts reconciling before and after every join.